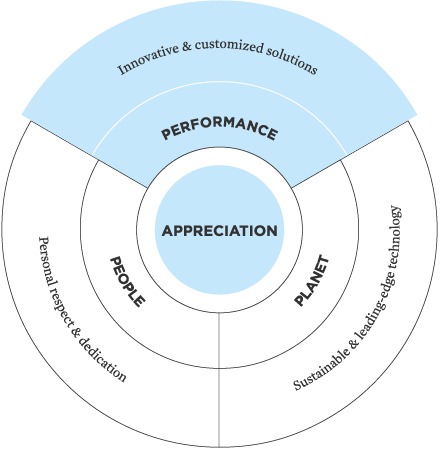
We create value through appreciating the needs of:
Our
customers
by providing competitive and innovative solutions
Our
employees
by adhering to our corporate values
Our
shareholders
by achieving above-average returns
Our
environment
by acting sustainably
»Our commitment to sustainability is owed to the simple recognition that financial performance is important, but it can only have lasting value when it is aligned with the interests of the society and the environment.«
HARIOLF KOTTMANN
Chief Executive Officer
Brand values
and the core of the brand

Economic
|
|
2015 |
2014 |
||||
|
||||||
|
Sales1 |
5 807 |
6 116 |
||||
|
EBITDA before exceptionals1 |
853 |
867 |
||||
|
EBITDA margin before exceptionals1 (%) |
14.7 |
14.2 |
||||
|
EBIT before exceptionals1 |
596 |
585 |
||||
|
Net income1 |
227 |
235 |
||||
|
Basic earnings per share1 (in CHF) |
0.67 |
0.55 |
||||
|
Adjusted earnings per share1 (in CHF) |
1.01 |
1.12 |
||||
|
Operating cash flow |
502 |
334 |
||||
|
Investment in property, plant and equipment |
374 |
310 |
||||
|
Research & Development expenditures1 |
204 |
213 |
||||
|
Total assets |
7 461 |
7 915 |
||||
|
Equity |
2 494 |
2 733 |
||||
|
Equity ratio (%) |
33.4 |
34.5 |
||||
|
Net debt |
1 312 |
1 263 |
||||
|
Gearing ratio (%) |
53 |
46 |
||||
|
Employees |
17 213 |
17 003 |
||||
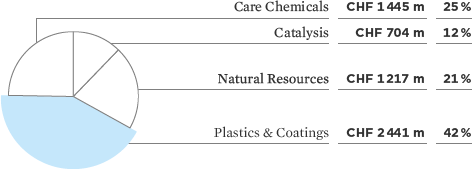
Sales by business area
Group sales: CHF 5 807 m

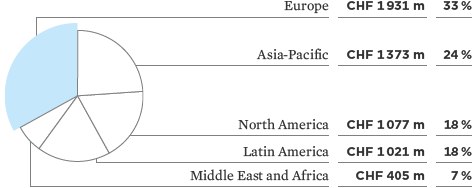
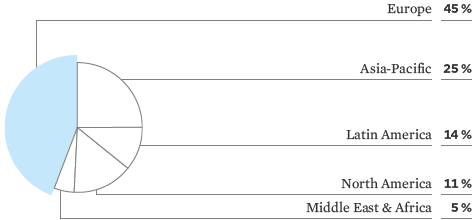
Sales by region
Group sales: CHF 5 807 m

SUSTAINABLE PRODUCT PORTFOLIO
>80
products received the EcoTain® label
at the end of 2015
76%
of the portfolio meet Clariant’s intended
sustainability standard
Social
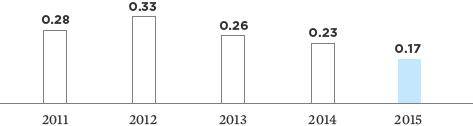
Lost Time Accidents
Occupational accidents with at least one day’s work lost
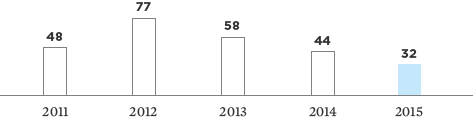

Occupational Accidents in Relation to Output LTAR1

1Continuing operations
Employees by Region in 2015

|
|
2015 |
2014 |
||
|
Employees (FTE) |
17 213 |
17 003 |
||
|
Personnel expenses (in CHF m) |
1 345 |
1 458 |
||
|
Training hours |
140 000 |
90 000 |
||
|
Age structure (%) |
|
|
||
|
<30 |
14.5 |
13 |
||
|
30 – 50 |
61.1 |
63.4 |
||
|
>50 |
24.4 |
23.6 |
|
Employee Category |
Gender |
FTE |
in % |
|||
|
Management (Level 1 – 5) |
|
817 |
4.7 |
|||
|
|
Female |
104 |
0.6 |
|||
|
|
Male |
713 |
4.1 |
|||
|
Employees (Non-ML) |
|
8 986 |
52.2 |
|||
|
|
Female |
3 047 |
17.7 |
|||
|
|
Male |
5 939 |
34.5 |
|||
|
Worker |
|
7 410 |
43.1 |
|||
|
|
Female |
604 |
3.5 |
|||
|
|
Male |
6 806 |
39.5 |
|||
|
Total |
|
17 213 |
100 |
Environmental
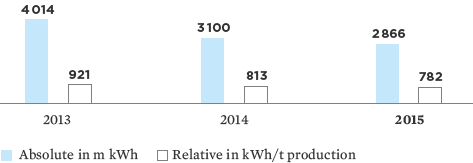
Energy Consumption

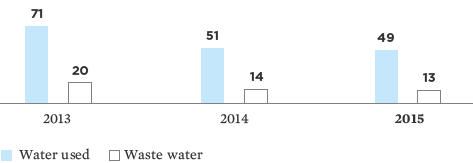
Water Consumption
in m m3

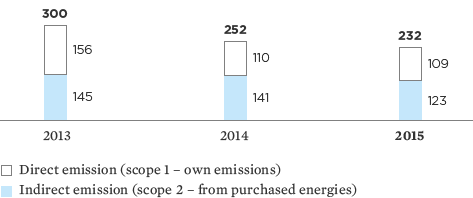
Greenhouse Gas Emissions
in kg/t production (CO2 equivalent)

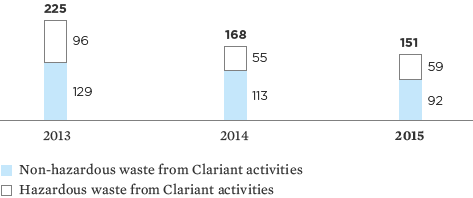
Quantity of waste
in thousand t

|
|
2015 |
2014 |
2013 |
|||||||
|
||||||||||
|
Sulphur dioxide SO2 |
310 |
3441 |
770 |
|||||||
|
Nitrogen oxide NOX |
5762 |
872 |
877 |
|||||||
|
Hydrogen chloride HCl |
57 |
39 |
39 |
|||||||
|
Ammonia NH3 |
24 |
22 |
30 |
|||||||
|
Dinitrogen monoxide N2O |
0.07 |
0.11 |
517 |
|||||||
|
Total inorganic emissions |
967 |
1 277 |
1 716 |
|||||||
|
Volatile organic compounds VOC |
183.5 |
191 |
350 |
|||||||
|
Methane CH4 |
0.2 |
0.2 |
0.4 |
|||||||
|
Total organic emissions |
184 |
191 |
350 |
|||||||
|
|
2015 |
2014 |
2013 |
|||
|
in t |
242 |
262 |
319 |
|||
|
in g/t production |
66 |
69 |
73 |
|
|
2015 |
2014 |
2013 |
|||
|
Material used |
3.97 |
4.12 |
4.50 |
|||
|
Production |
3.66 |
3.81 |
4.36 |
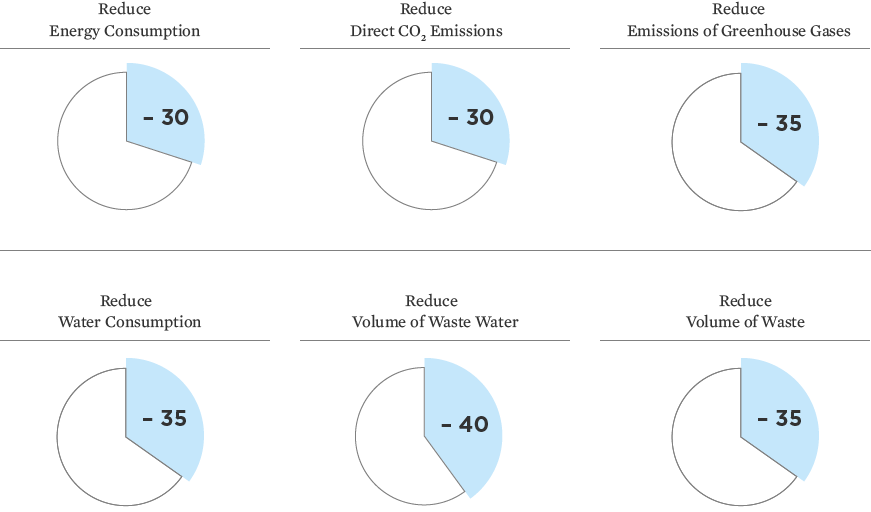
Environmental targets 2025
in % (per t produced goods)

CO2 equivalent
CO2 equivalent is a parameter describing the effect of greenhouse gas emissions. A factor known as the global warming potential (GWP) shows the effect of the individual gases compared with CO2 as the reference value. VIEW ENTIRE GLOSSARY