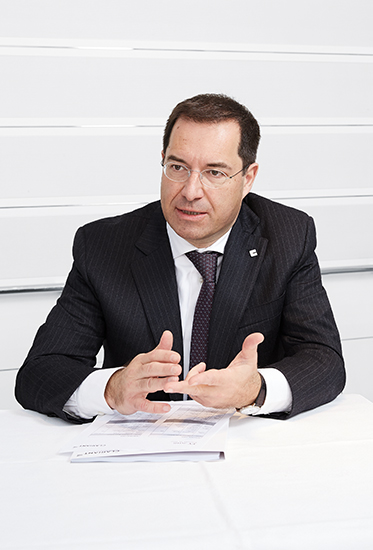
Clariant significantly increased margin and cash flow despite challenging economic conditions. Chief Financial Officer, Patrick Jany, discusses the results achieved in 2016 and future priorities, including Clariant’s relationship with financial market participants in Asia and globally.
Mr. Jany, as the CFO, are you satisfied with Clariant’s performance in 2016?
Patrick Jany Absolutely! In 2016, we increased our EBITDA margin by 50 basis points to 15.2% and more importantly we increased our operating cash flow by 29% to CHF 646 million. This was the highest operating margin since 2000 and the highest operating cash flow since 2009, which shows the progress made in the last years. We have repositioned our portfolio, optimized processes, reduced costs and are now focusing on sustainably growing the business through innovations.
Nevertheless, Clariant is still operating in a difficult economic environment. What challenges does the company have to face in this environment?
In general terms we continue to see a rather weak growth in our markets with the rebound in Asia being offset by the slowdown in Latin America. Two of our main growth markets, Oil Services and Catalysts, in particular, are still in a transition phase, which has slowed our growth down in 2016. While this situation is expected to continue for the major part of 2017, the mid-term prospects are positive and we are actively investing to participate in the upturn of those industries. While those fluctuations are part of normal business and will not impede our growth over the cycle, the main risk is currently rather the political uncertainty.
»Our portfolio quality and operational excellence allow us to progress in terms of margins and cash generation, even in a rather difficult economic environment.«
Patrick Jany Chief Financial Officer
In the past year, Clariant used various financial instruments, such as bonds and a syndicated loan. Why was this necessary?
In 2016, we completed the refinancing of the company and now have a well balanced long-term maturity profile at attractive conditions. This allows us to repay our largest euro-denominated bond of over EUR 500 million and to benefit from lower interest charges going forward.
How does the stock market perceive Clariant’s performance? Did Clariant’s shares decline slightly in 2016 compared to the previous year?
The Swiss stock market declined overall in 2016 following a strong performance in 2015, and Clariant was no exception. While the perception of Clariant has greatly improved over the years, the weak economic prospects weighed on the share price, as our performance is sometimes perceived to be more cyclical than it actually is. It is therefore important to continue to demonstrate that the quality of our portfolio and our operational excellence allow us to progress in terms of margins and cash generation quarter after quarter, even in a rather difficult economic environment.
How will you convince the financial markets that Clariant is still a good investment?
We are on track to achieve our goal of an EBITDA margin of 16 – 19% and to grow sales by 4 – 5% annually in local currencies. Our Care Chemicals business is very well positioned. The decision to focus Plastics & Coatings on cash generation was the right one, and it has produced very good results. For 2017, we see even more potential in those areas while Catalysis and Oil & Mining Services will be important growth engines mid-term.
These growth and cash generation capabilities are certainly attractive and reflect our focus on long-term, sustainable value creation. As we take the social and environmental aspects of sustainability seriously and place them at the center of efforts, we also offer a unique investment platform combining a strong sustainablity approach with a focused specialty portfolio, operational excellence and innovation. This year’s integrated reporting is certainly an expression of this multi-dimensional approach.
Clariant is increasingly investing in China. Are Chinese investors also investing in Clariant?
Asian investors have gained in importance over the years and are active investors around the world. We have implemented a structured approach to Asia, with roadshows in Shanghai, Hong Kong and Beijing for the first time in 2016, in order to establish closer ties. Our current presence and strong focus on Asia, and China in particular, is certainly increasing our appeal to Asian investors. In general, it is important for us to broaden our investor basis in emerging markets, including for instance Latin America, as this better reflects our actual geographical presence, with close to 50% of our revenues coming from emerging markets.
What are Clariant’s objectives in 2017?
The overall outlook remains unchanged for 2017. We strive for top-line growth and intend to further increase our absolute EBITDA, the EBITDA margin, and our operating cash flow.

