Profit and financial situation
»We increased profitability and significantly improved operating cash flow.«
Hariolf Kottmann Chief Executive Officer
»We increased profitability and significantly improved operating cash flow.«
|
|
2016 |
2015 |
Change in % |
|||||
|
||||||||
|
Sales |
5 847 |
5 807 |
1 |
|||||
|
Gross profit on sales |
1 770 |
1 785 |
–1 |
|||||
|
EBITDA1 |
887 |
853 |
4 |
|||||
|
Margin1 (%) |
15.2 |
14.7 |
– |
|||||
|
EBIT1 |
622 |
596 |
4 |
|||||
|
Margin1 (%) |
10.6 |
10.3 |
– |
|||||
|
EBIT |
512 |
496 |
3 |
|||||
|
Income before taxes |
338 |
300 |
13 |
|||||
|
Net income |
263 |
227 |
16 |
|||||
|
Basic earnings per share |
0.78 |
0.67 |
16 |
|||||
|
Adjusted earnings per share |
1.12 |
1.01 |
11 |
|||||
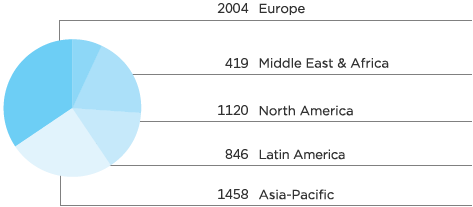
Group sales increased by 2% in local currency to CHF 5 847 (2015: CHF 5 807 million) in comparison to the previous year, led by consistent quarterly volume growth in 2016. The group encountered a negative exchange rate effect of 1% which therefore resulted in a growth rate of 1% in Swiss francs. The strongest sales growth performance was realized in the first quarter, mainly driven by volume increases and new product launches.


1 LC = Local currency

1 LC = Local currency
|
|
2016 |
2015 |
Change in % |
Change in LC1 in % |
||||||
|
||||||||||
|
Care Chemicals |
1 465 |
1 445 |
1 |
5 |
||||||
|
Catalysis |
673 |
704 |
–4 |
–8 |
||||||
|
Natural Resources |
1 184 |
1 217 |
–3 |
2 |
||||||
|
Plastics & Coatings |
2 525 |
2 441 |
3 |
4 |
||||||
|
Total |
5 847 |
5 807 |
1 |
2 |
||||||
The 2016 sales development across the portfolio was impacted by the different economic markets and businesses environments. Despite the volatile markets, group sales progressed for the full year, both in local currencies as well as in Swiss francs. Sales in Care Chemicals increased by 5% in local currency (1% in CHF) due to continued strong growth in the area of Consumer Care, mainly driven by Personal Care. Sales in Catalysis decreased by 8% in local currency (–4% in CHF) impacted by a softer demand in North America and Asia. Natural Resources sales increased in local currency by 2% (–3% in CHF). Functional Minerals delivered good sales growth in 2016, while the Oil & Mining Services business reported a negative sales performance during the full year which, however, was less pronounced than the industry trend. The acquisitions in Oil & Mining Services in North America which were consolidated in the last quarter of the year had a positive impact on sales of the Business Area of 4%. Plastics and Coatings sales rose by 4% in local currency (3% in CHF) benefiting from the differentiated steering which was implemented at the beginning of 2016.
The gross margin declined from 30.7% in 2015 to 30.2% in 2016 due to a realignment of reporting. Excluding this effect, the margin was comparable to last year.
Clariant’s EBITDA before exceptional items advanced by 4% in Swiss francs (5% in local currency) to CHF 887 million (2015: CHF 853 million). The EBITDA margin before exceptional items continued to expand by 50 basis points from 14.7% in the previous year to 15.2% for the full year of 2016.
The expansion of the EBITDA before exceptional items was primarily attributable to the Business Area Plastics & Coatings (+17% in local currency; +18% in CHF) and Care Chemicals (+2% in local currency; +1% in CHF). Despite the challenging industry environment, Natural Resources grew by 2% in local currency (–3% in CHF) while Catalysis was below the previous year (–12% in local currency; –10 % in CHF).
|
|
2016 |
2015 |
Change in % |
Change in LC2 in % |
||||||||||||
|
||||||||||||||||
|
Care Chemicals |
276 |
272 |
1 |
2 |
||||||||||||
|
Catalysis3 |
160 |
177 |
–10 |
–12 |
||||||||||||
|
Natural Resources |
200 |
206 |
–3 |
2 |
||||||||||||
|
Plastics & Coatings |
368 |
313 |
18 |
17 |
||||||||||||
|
Total4 |
887 |
853 |
4 |
5 |
||||||||||||
|
|
2016 |
2015 |
||||||
|
||||||||
|
Care Chemicals |
18.8 |
18.8 |
||||||
|
Catalysis2 |
23.8 |
25.1 |
||||||
|
Natural Resources |
16.9 |
16.9 |
||||||
|
Plastics & Coatings |
14.6 |
12.8 |
||||||
|
Total |
15.2 |
14.7 |
||||||
The continued progress in EBITDA margin expansion before exceptional items was mainly the result of the Business Area Plastics & Coatings which reflects the better product mix, the higher capacity utilization and the effect of the differentiated business steering implemented at the beginning of 2016. Care Chemicals and Natural Resources both delivered stable EBITDA margins before exceptional items in 2016 versus the previous year. In Catalysis, the EBITDA margin before exceptional items declined compared to the previous year due to lower demand in Asia and North America.
Over the past years, Clariant has implemented a number of actions to continue to advance the group’s performance in terms of profitability and cash flow generation.
The streamlining of business processes and structures generated expenses of CHF 107 million in 2016 (2015: CHF 115 million). The impairment loss recognized in 2016 of CHF 8 million was lower than in 2015 (CHF 14 million).
The operating income (EBIT) increased in 2016 to CHF 512 million (2015: CHF 496 million) as a result of an improved operating business performance and additional cost efficiencies.
The negative financial result decreased from CHF 196 million to CHF 174 million in 2016 mainly due to more favorable currency results. After taxes the net income increased by 16% to CHF 263 million compared to CHF 227 million in 2015 as a result of the continued expansion in absolute EBITDA, lower finance costs, and an improvement in the tax rate.
Based on the solid business development delivered by Clariant in 2016, Clariant’s Board of Directors has decided to make the proposal to the general assembly for an increased distribution of CHF 0.45 per share for 2016. The corresponding proposal will be presented at the 22nd Annual General Meeting on 20 March 2017.
As of 31 December 2016, the balance sheets totals have been increased from CHF 7 461 million in the previous year to CHF 8 365 million, mainly due to the acquisition of the North American oilfield production chemicals business from Kel-Tech and X-Chem and an increase in cash and near cash assets. The Group’s liquidity position increased from CHF 941 million to CHF 1 320 million, in order to repay the EUR 500 million bond in January 2017.
The investments in associates and joint ventures decreased in the year-to-year comparison from CHF 586 million to CHF 516 million due to equity repayment and dividends received from Stahl.
In the reporting period, Clariant’s equity increased from CHF 2 494 million to CHF 2 546 million, predominantly due to the net profit for the period amounting to CHF 263 million. Other reasons for the increase are profits on treasury shares transactions of CHF 24 million and transactions with non-controlling interests in the amount of CHF 29 million.
Net debt increased from CHF 1 312 million to CHF 1 540 million as a consequence of acquisitions. This figure includes current and non-current financial debt, cash and cash equivalents, near-cash assets, and financial instruments with positive fair values. As a consequence, the gearing ratio (net financial debt to equity) increased from 53% to 60%.
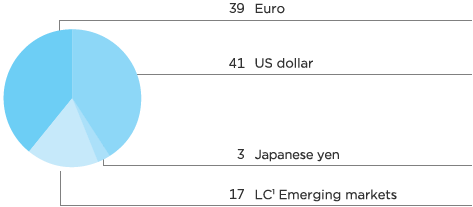
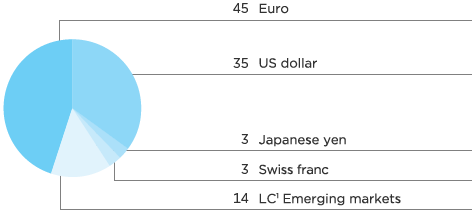
In the fiscal year 2016, Clariant’s financing structure was again on a very sound level. The company has a broadly diversified maturity structure of its financial liabilities with a long-term focus reaching until 2026. The Company was able to secure this with favorable financing terms.
On 26 April 2016, Clariant issued four certificates of indebtedness with a total sum of EUR 300 million. These certificates have a term of 4 years (EUR 212 million), 7 years (EUR 73 million) and 10 years (EUR 15 million).
On 5 August 2016, Clariant issued five Certificates of Indebtedness with a total sum of USD 277 million and EUR 95 million. These certificates have terms of 5 years (EUR 55 million and USD 227 million) and 7 years (EUR 40 million).
On 16 December 2016, Clariant signed an agreement for a new CHF 500 million five-year multi-currency Revolving Credit Facility (RCF) with two one-year extension options. The RCF is structured as a »back-stop« facility for rating purposes to maintain Clariant’s liquidity headroom.
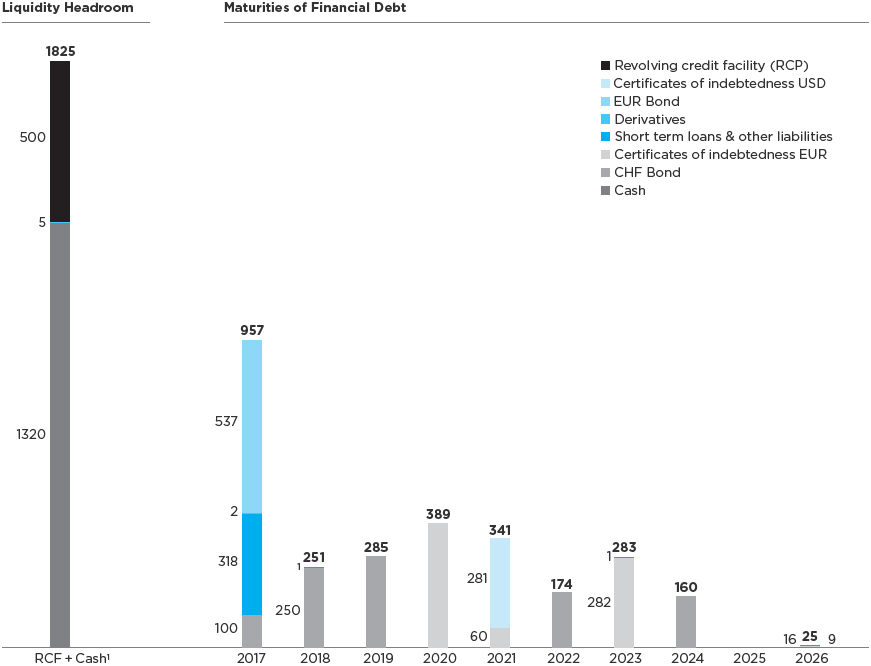

1 incl. near cash assets and financial instruments at positive fair values
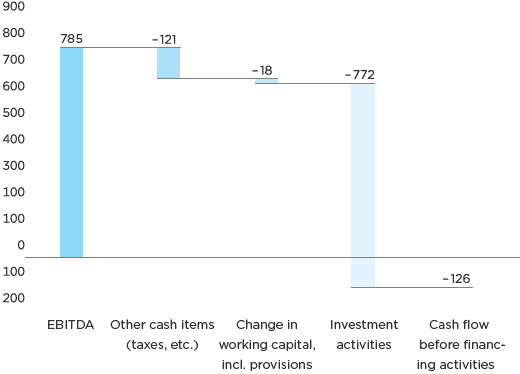
Cash flow before changes in net working capital increased from CHF 570 million in the previous year to CHF 664 million.
Net income climbed to CHF 263 million from CHF 227 million in the previous year. The increase came from the continued expansion in absolute EBITDA, lower finance costs, and an improvement in the tax rate.
Changes in net working capital including provisions amounted to CHF – 18 million in 2016 (2015: CHF – 68 million). The ratio of net working capital to sales increased from 17.7% to 18.6%.
Cash flow from operating activities continued to rise to CHF 646 million versus CHF 502 million in 2015, coming from higher profit, lower cash out for exceptional items and lower income taxes paid.
Cash flow from investing activities decreased to CHF – 772 million (2015: CHF – 335 million). This figure was mainly influenced by capital expenditure of CHF 297 million (2015: CHF 374 million) and by the acquisitions realized during the year (2016: CHF 421 million; 2015: CHF 22 million). Free cash flow which equates to operating cash flow after capital expenditure and investments in intangible assets increased to CHF 310 million (2015: CHF 101 million).

|
|
31.12.2016 |
31.12.2015 |
||
|
Net Income |
263 |
239 |
||
|
Reversals of non-cash items |
419 |
448 |
||
|
Cash flow before changes in net working capital and provisions |
664 |
570 |
||
|
Operating cash flow |
646 |
502 |
||
|
Cash flow from investing activities |
–772 |
–335 |
||
|
Cash flow from financing activities |
411 |
–84 |
||
|
Net change in cash and cash equivalents |
254 |
41 |
||
|
Cash and cash equivalents at the beginning of the period |
789 |
748 |
||
|
Cash and cash equivalents at the end of the period |
1 043 |
789 |
The EBITDA margin is calculated based on the ratio of EBITDA to sales and shows the return generated through operations from sales before depreciation and amortization. VIEW ENTIRE GLOSSARY
Exceptional items are defined as non-recurring costs or income that have a significant impact on the result, for example expenses related to restructuring measures. VIEW ENTIRE GLOSSARY
Economic indicator representing the operational net inflow of cash and cash equivalents during a given period. VIEW ENTIRE GLOSSARY
Joint ventures are all activities in which Clariant is involved with another partner. The accounting method applied for joint ventures depends on the specific conditions of the participation. VIEW ENTIRE GLOSSARY
Gearing is an indicator of the indebtedness of a company and reflects a company’s ratio of long-term debt to equity capital. VIEW ENTIRE GLOSSARY
A rating assesses the creditworthiness of a debtor. Ratings are mainly required for the issue of debt instruments and usually determine the level of necessary interest payments, among other things. Clariant currently uses the two rating agencies, Moody’s and Standard & Poor’s, for this purpose. VIEW ENTIRE GLOSSARY
Net working capital is the difference between a company’s current assets and its current liabilities. VIEW ENTIRE GLOSSARY
Economic indicator representing the operational net inflow of cash and cash equivalents during a given period. VIEW ENTIRE GLOSSARY
Free cash flow is the cash flow from operating activities minus expenditure for property, plant, and equipment, and intangible assets. VIEW ENTIRE GLOSSARY