Increasing challenges across the industry

Clariant faces increasing volatility, uncertainty, and complexity in its business environment. Changes in demand are more sudden and dramatic than in the past, and competitive pressures are increasing customer service requirements. For example, long lead times for customer orders in the chemical industry were typical, but now customers often request products with only a few days turnaround.

While these demands exist around the globe, each region has specific experiences. For example, in China where competition is particularly fierce, short lead times for the customer are key to securing orders. In regions whose economies have a strong oil focus, such as the US, Brazil, or the Middle East, cost competitiveness is the major factor. Each scenario requires customized changes to the supply chain to be successful in the marketplace.

18.6%
Net working capital With 18.6% the ratio of net working capital to sales is substantially below the Group’s target of 20%.

Meeting challenges with a holistic approach

Clariant builds on its earlier Operational Excellence initiatives to tackle Customer to Cash in a holistic way. Rather than optimizing planning, sourcing, production, and logistics separately, cross-functional teams connect the dots by optimizing the whole value chain. This process includes lean implementation plans to make sure a facility’s door-to-door material and information flow operates efficiently. Improvements encompassing the overall process flow are visualized and translated into targeted kaizen activities for continuous improvement.

In 2016, an integrated planning landscape was rolled out in three of the seven Business Units. This consisted of organizational enhancements, best practice planning processes, and an advanced supply chain planning and optimization tool. Combined with the order management and manufacturing execution systems and continuous improvements, cost savings of more than CHF 1 million, additional sales of CHF 25 million and reduction in net working capital of more than CHF 15 million across the Group were achieved in 2016, while service levels also increased.

Working together to optimize a large supply chain

Clariant sources raw materials, capital goods, and other services and inputs from suppliers around the world. In 2016, Clariant purchased roughly CHF 2.2 billion worth of raw materials from around 5 250 suppliers and CHF 1.3 billion of other products and services, such as technical equipment or energy, from roughly another 26 250 suppliers. To reduce purchasing spend in such a large supply chain, Clariant Procurement Excellence (CPX) analyses the purchasing categories. Raw materials were harmonized wherever possible and de-specification was tested. Workshops conducted with suppliers explored win-win situations by looking into new business development and innovations.

»An optimized value chain is essential for business success. Clariant’s new production plant for pigment preparations in Santa Clara, Mexico, produces closer to our customers in North and Latin America and supports on-time, in-full delivery.«

Michael Grosskopf Head of Business Unit Pigments

Clariant selects its suppliers, outsourcing partners, and service providers based on extensive criteria that include not only economic and product-specific performance, but also sustainability factors. In 2014, Clariant joined the chemical industry’s Together for Sustainability initiative for sustainable supplier management. Independent experts perform supplier evaluations and audits, and the participating companies have access to the results. This helped Clariant cover more than 60% of its raw material supply base by spend with sustainability evaluations in 2016.

Ensuring safe and efficient production and delivery

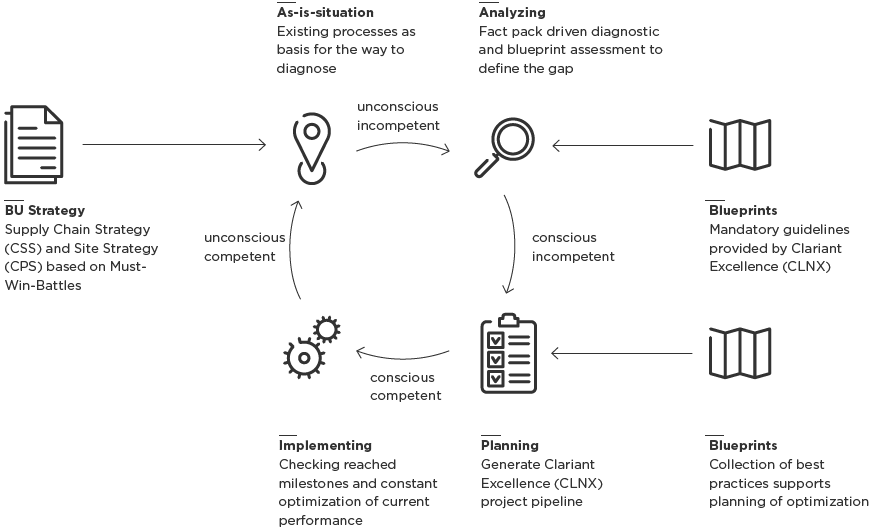
Clariant integrates lean methodologies throughout the Customer to Cash process to achieve safe, sustainable, and profitable operations. By combining multiple initiatives, the company can create powerful synergies that benefit the Business Units. For example, in 2016 a value chain diagnostic for the Business Unit Functional Minerals was established. It integrates Clariant Supply Chain System (CSS) and Clariant Production System (CPS) methods to uncover key levers for increased productivity, reduced conversion costs, and stronger demand planning and inventory management in Southeast Asia/Pacific. Investments such as the new pigment preparation plant in Santa Clara, Mexico, increase proximity between production and customers and thus support on-time, in-full delivery.

TfS
Clariant participates in the chemical industry’s Together for Sustainability (TfS) initiative that provides access to supplier sustainability evaluations and audits conducted by independent experts.

While the lean process is considered the engine of continuous improvement, the management of safety, health, and environmental aspects is the essential lubricant that enables the engine to function properly. By avoiding accidents, Clariant protects its employees while also ensuring that production disruptions are minimized. Training and investments in plant safety substantially improved the Lost Time Accident Rate (LTAR), which measures the number of occupational accidents with at least one day of work lost relative to 200 000 hours of work. The LTAR fell from 0.92 in 2007 to 0.19 in 2016 (2015: 0.17).

Optimizing inventory levels while ensuring high service levels

Clariant’s Inventory Health Check program is a key initiative to optimize cash flow in the Customer to Cash phase. The Inventory Health Check starts with an analysis of inventory performance indicators to determine the health status of a Business Unit’s inventories. With the assistance of experts from the Business Unit, it then pinpoints inefficiencies, identifies appropriate measures to improve inventory performance while ensuring high customer service levels, and determines the roadmap to improve the conversion of EBITDA to cash.

»The Inventory Health Check improved our inventory levels and cooperation with the Clariant Supply Chain System team is excellent.«

John Dunne Head of Business Unit Oil & Mining Services

Inventory Health Check pilot projects carried out jointly between Clariant Operational Excellence and the Business Unit Oil & Mining Services have successfully optimized inventory levels. For example, after an Inventory Health Check at Oil & Mining Services in Latin America, stock levels dropped significantly without affecting on-time, in-full delivery. In fact, the IFR (inventory fill rate) – the fraction of customer demand that is met through immediately available stock – has increased steadily since the Inventory Health Check measures were implemented.

Based on the impact of the pilot projects, a number of additional projects across multiple Business Bnits have been conducted in Europe, the Americas and Asia were further success stories have been written. This includes a 50% inventory reduction within a 12 months’ period for a project in North America.

Steps of the steering process

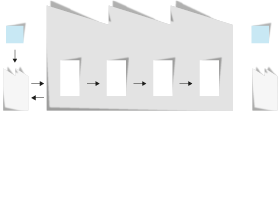
Plan – balance supply & demand (graphic)
Plan – balance supply & demand Accurate demand planning is undertaken to create a well-connected sales and production process. By focusing on balancing service, costs, and net working capital, integrated supply chains are established.
Source – optimizing spend effectiveness (graphic)
Source – optimizing spend effectiveness Procurement Excellence seeks to increase spend effectiveness by optimizing commercial, technical, demand, and process levers.
Make – constant monitoring for high efficiency (graphic)
Make – constant monitoring for high efficiency To ensure continuous operational improvements, Clariant uses Value Stream Mapping and other diagnostic insights to monitor constantly the current situation, compare it to best practices, and run its assets at the highest possible level of efficiency.
Deliver – alignment of commercial and operations to ensure OTIF (graphic)
Deliver – alignment of commercial and operations to ensure OTIF The best possible cooperation between Commercial and Operations ultimately allows Clariant to deliver its finished goods on-time and in-full (OTIF) as required by the customer.


Business model

In the Customer to Cash phase process optimization creates added value.

business model

input

Performance
297 Investments in property, plant and equipment in CHF m
2 221 Raw material procurement in CHF m
people
5 250 Suppliers of raw material
>60% Raw material supply base by spend covered by sustainability evaluations
planet
76 Production facilities
2.82 Raw materials procured in m t
2 950 Energy consumption in m kWh
48 Water consumption in m m3

output

Performance
5 847 Sales in CHF m
15.2% EBITDA margin before exceptional items
646 Operating cash flow in CHF m
people
0.19 Lost time accident rate (LTAR, accidents with at least 1 day lost/200 000 work hours)
planet
4.09 Production volume in m t
0.89 Greenhouse gas emissions (scope 1 & 2) in t
13 Waste water in m m3
147 Waste in thousand t
  • Financial capital
  • Intellectual capital
  • Human capital
  • Relationship capital
  • Manufactured capital
  • Natural capital

Value Creation in Practice Reducing cost and environmental impacts

Reducing cost and environmental impacts (graphic)Reducing cost and environmental impacts (graphic)

Production efficiency case Addressing improvement potentials through YEE

One of Clariant’s strategic goals is to incrementally increase chemical yield while lowering energy and water consumption, and other environmental impacts (YEE). For this reason, Clariant established a dedicated YEE team in 2012 to analyze production plants with this goal in mind. The analysis follows a two-step approach, whereby the YEE specialists, chemical engineering expert, and the operations team perform intensive diagnostics of potential improvement areas. During the last four years, the program uncovered high benefit potential in about 25 plants in 15 different production sites, resulting in more than 600 improvement measures, most of which have already been implemented. As about 80% of expenditures in Clariant’s Business Units are allocated to raw materials, energy, and environmental technology, there is a huge savings potential in this area.

Since the inception of YEE in 2012, the program led to savings of more than CHF 50 million.

Potential savings with Clariant’s YEE program (based on costs in 2012)
Costs in CHF m Potential benefit Total estimated benefits in CHF m
Raw material 2 161 × 2.0%1 = 43
Energy 157 × 8.5%2 = 13.3
Environment 32 × 8.5%2 = 2.7

1 Raw material cost savings through yield and cost improvement

2 Based on previous experience in energy efficiency programs

Achieving progress Environmental targets 2025

Joachim Krüger, Head of Corporate Sustainability & Regulatory Affairs (portrait)

»Clariant has set six ambitious environmental targets for 2025. While we have achieved progress toward all of them, this has also set the bar for further improvements even higher. In order to continue to advance and optimally align investments, our cross-company 2025 Target Team closely works together.«

Joachim Krüger Head of Corporate Sustainability & Regulatory Affairs

Initiatives such as Clariant’s eWatch program on production facility optimization and employee training with regard to energy efficiency, and the Inspire Water program on waste water reduction currently being pilot tested in Spain, have contributed to Clariant’s ambitious environmental targets. Using less raw material, consuming less energy, and reducing emissions and waste are essential for Clariant to reach its environmental targets. By 2025, Clariant wants to achieve significant improvements in six major parameters compared to the base year 2013. Relative to product volume and in comparison to the base year 2013, energy consumption and CO2 emissions should be reduced by 30%. The emission of greenhouse gases should be reduced by 35%, to the same extent as the amount of water used and the volume of waste. The waste water volume should even be reduced by 40% within 12 years.

Environmental targets (per t produced goods)
–30% Reduction of Energy Consumption
–30% Reduction of Direct CO2 Emissions
–35% Reduction of Emissions from Greenhouse Gases
–35% Reduction of Water Consumption
–40% Reduction of Volume of Waste Water
–35% Reduction of Volume of Waste

FURTHER READING