Performance
|
2016 |
2015 |
Change in % |
|||||
|
||||||||
Sales |
5 847 |
5 807 |
1 |
|||||
Gross profit on sales |
1 770 |
1 785 |
–1 |
|||||
EBITDA1 |
887 |
853 |
4 |
|||||
Margin1 (%) |
15.2 |
14.7 |
– |
|||||
EBIT1 |
622 |
596 |
4 |
|||||
Margin1 (%) |
10.6 |
10.3 |
– |
|||||
EBIT |
512 |
496 |
3 |
|||||
Income before taxes |
338 |
300 |
13 |
|||||
Net income |
263 |
227 |
16 |
|||||
Basic earnings per share |
0.78 |
0.67 |
16 |
|||||
Adjusted earnings per share |
1.12 |
1.01 |
11 |
|||||
Sales by Region – continuing operations in CHF m
Group sales: 5 847

|
2016 |
2015 |
Change in % |
Change in LC1 in % |
||||||
|
||||||||||
Care Chemicals |
1 465 |
1 445 |
1 |
5 |
||||||
Catalysis |
673 |
704 |
–4 |
–8 |
||||||
Natural Resources |
1 184 |
1 217 |
–3 |
2 |
||||||
Plastics & Coatings |
2 525 |
2 441 |
3 |
4 |
||||||
Total |
5 847 |
5 807 |
1 |
2 |
||||||
in CHF m |
2016 |
2015 |
||
Wages and salaries |
–1 062 |
–1 036 |
||
Social welfare costs |
–246 |
–255 |
||
Shares and options granted to directors and employees |
–9 |
–15 |
||
Pension costs – defined contribution plans |
–24 |
–21 |
||
Pension costs – defined benefit plans |
–41 |
–17 |
||
Other post-employment benefits |
–1 |
–1 |
||
Total personnel expenses |
–1 383 |
–1 345 |
People
in full time equivalents (FTE) or headcount (heads) as indicated |
2016 |
2015 |
||||||||||||
|
||||||||||||||
Total Staff (FTE) |
17 442 |
17 213 |
||||||||||||
Global Management1 (FTE) |
814 |
817 |
||||||||||||
Women in Global Management1 (FTE) |
114 |
104 |
||||||||||||
Men in Global Management1 (FTE) |
700 |
713 |
||||||||||||
General Staff2 (FTE) |
16 628 |
16 396 |
||||||||||||
Women in General Staff2 (FTE) |
3 599 |
3 652 |
||||||||||||
Men in General Staff2 (FTE) |
13 029 |
12 744 |
||||||||||||
Turnover rate3 |
10.7% |
10.4% |
||||||||||||
Participants (heads) in 360 degree feedbacks (ML 1- 5 +) |
975 |
1 050 |
||||||||||||
Staff (heads) participated in performance dialogs |
9 000 |
7 880 |
||||||||||||
Total training hours |
201 884 |
182 3984 |
||||||||||||
Training hours per participant (heads) |
19 |
20 |
||||||||||||
Personnel expenditures in m CHF5 |
1 383 |
1 345 |
||||||||||||
FTE by Region
Total Staff 17 442

|
2016 |
2015 |
2014 |
2013 |
2012 |
|||||||
|
||||||||||||
LTAR1 |
0.19 |
0.17 |
0.23 |
0.26 |
0.33 |
|||||||
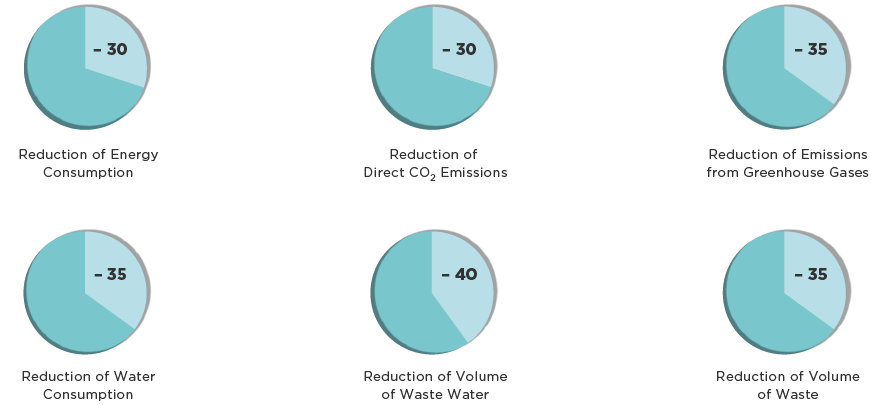
Planet
Environmental Targets 2025
(in % per t produced goods compared to 2013)
|
2016 |
2015 |
2014 |
|||
Absolute in m kWh |
2 950 |
2 866 |
3 100 |
|||
Relative in kWh/t production |
720 |
782 |
813 |
|
2016 |
2015 |
2014 |
|||
Direct emission (scope 1) (in m t CO2) |
0.41 |
0.40 |
0.42 |
|||
in kg/t production |
101 |
109 |
110 |
|||
Indirect emission (scope 2) (in m t CO2) |
0.48 |
0.45 |
0.54 |
|||
in kg/t production |
117 |
123 |
141 |
|||
Total emission (in m t CO2) |
0.89 |
0.85 |
0.96 |
|||
in kg/t production |
218 |
232 |
252 |
|
2016 |
2015 |
2014 |
|||
Water Used in m m3 |
48 |
49 |
51 |
|||
Relative in m3/t product |
11.7 |
13.3 |
13.4 |
|
2016 |
2015 |
2014 |
|||
Waste water discharge (in m m3) |
13.2 |
13.3 |
13.7 |
|||
Relative in m3/t production |
3.23 |
3.63 |
3.60 |
|
2016 |
2015 |
2014 |
|||||||||
|
||||||||||||
Hazardous waste1 |
54 |
59 |
55 |
|||||||||
Non-hazardous waste1 |
92 |
92 |
113 |
|||||||||
Total waste |
147 |
151 |
168 |
|||||||||
Hazardous waste2 |
|
|
|
|||||||||
Recycling |
20 |
18 |
19 |
|||||||||
Treatment |
39 |
47 |
36 |
|||||||||
Landfill |
10 |
6 |
8 |
|||||||||
Non-hazardous waste2 |
|
|
|
|||||||||
Recycling |
17 |
18 |
26 |
|||||||||
Treatment |
7 |
8 |
12 |
|||||||||
Landfill |
69 |
68 |
81 |
|||||||||