The CoC regularly reviews the level and structure of the compensation packages for members of the EC. In 2013 Clariant conducted selected market benchmarks regarding the chemical peers for the EC and the Board of Directors and enlarged our survey activities for all global positions around the world. In our Individualized Chemical Benchmark analysis, we focused on companies which are defined in our relevant peer group of the newly introduced Performance Share Unit (PSU) Plan (see page 136).
Key focus elements are:
a) Comparison of management remuneration packages of European chemical companies with global scope
b) Comparison of management remuneration of Swiss-based multinational companies
The bonus amounts of the total compensation packages are paid out in relation to the achieved results for a particular financial year. The actual bonus amounts may vary between zero and target values (= 100%) in the financial year in question.
REMUNERATION STRUCTURE
of the Clariant Executive Committee
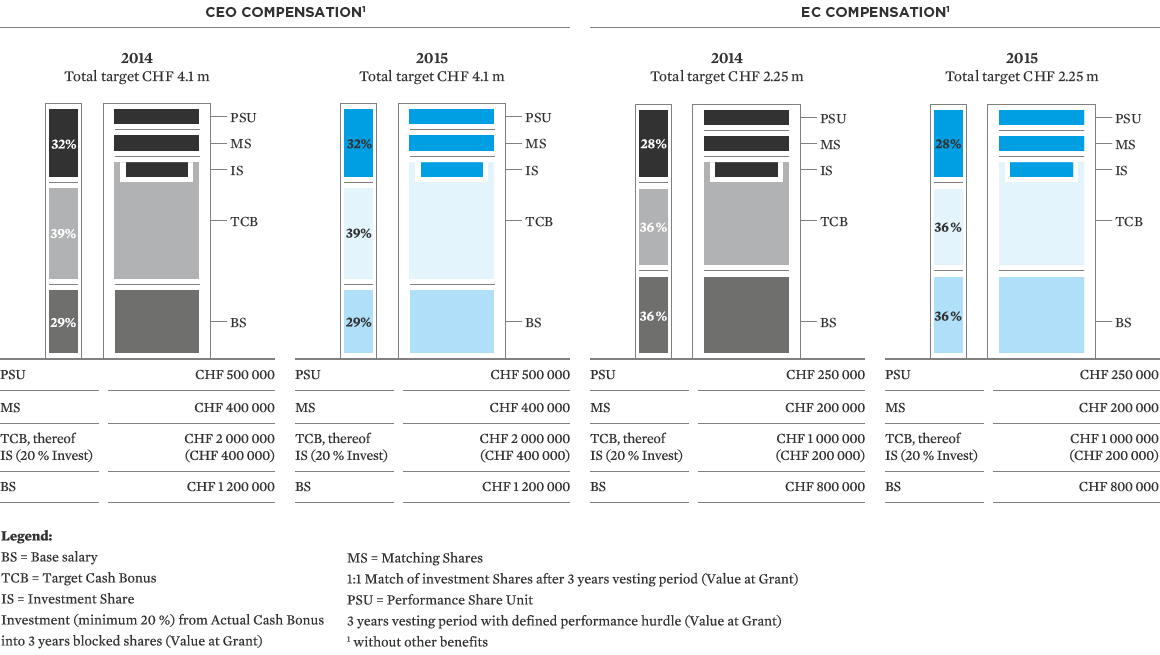

Base salary and variable remuneration
It is important to highlight that the Executive Committee participates in the same bonus programs as the senior managers. Therefore, they participate in the GMBP, Performance Share Unit Plan and the GSM-LTIP.
As an outcome of the benchmarking exercise, the remuneration structure of the EC was adjusted in 2013 (after a fixation of terms in 2011 and 2012) to the following general structure for 2014 and 2015 (see chart above).
Other benefits
The members of the EC participate in the pension plans of the Clariant Group, notably the Clariant pension fund with an insured income of up to CHF 200 000 per annum, and the management pension fund with an insured income of up to a further CHF 646 000 per annum. The maximum insured income under the pension plans therefore stands at CHF 846 000 per annum. The CEO participates in Clariant’s pension and insurance plans, additional pension provisions are accrued over time in order to match contractually granted retirement plans.
Clariant’s pension plans conform with the legal framework of the occupational pension scheme (BVG). In future, the maximum contribution will be dynamically aligned with Art. 79c BVG. For members of the EC and all other Clariant employees, the insured income is defined as the base salary plus 50% of target cash bonus. Equity-linked income components are not subject to pensionable income. The usual term insurance policies for death and disability form part of Clariant’s pension plans. The total employer contribution is approximately 11% of the insured income in the case of the Clariant pension fund, and 22% of the insured income in the case of the Clariant management pension fund. These contributions cover both the contributions to the formation of retirement capital, and the risk components. Under IFRS the Clariant pension fund is a defined benefit plan. The management pension fund provides the members with retirement capital upon retirement, pension payments are only accepted on exceptional basis.
During the year 2015, there was no personnel change within the Executive Committee.
In accordance with the reporting needs outlined in the Ordinance against Excessive Compensation (OaEC) we will disclose the relevant Fair Market Value (FMV) figures in the following audited table.
In both years there were no payments to leaving members of the Executive Committee nor were any loans or credits outstanding and or granted.
So the overall total compensation 2015 to the Executive Committee was below the approved budget of CHF 14.5 million (94%). This budget approval was made for the year 2015 at the Annual General Meeting in 2014.
Please find below the information about the actual share and option ownership of the Members of the Executive Committee.
|
Hariolf Kottmann |
Other EC members |
Totals 2015 |
|||||||
|
||||||||||
Base salary |
1 200 000 |
2 400 000 |
3 600 000 |
|||||||
Cash bonus1 |
1 585 600 |
2 576 600 |
4 162 200 |
|||||||
Share-based bonus (FMV) |
1 209 158 |
1 358 480 |
2 567 638 |
|||||||
Other benefits2 |
1 674 403 |
1 588 909 |
3 263 312 |
|||||||
Total |
5 669 161 |
7 923 989 |
13 593 150 |
|||||||
|
Hariolf Kottmann |
Other EC members |
Totals 2014 |
|||||||||
|
||||||||||||
Base salary |
1 200 000 |
2 400 000 |
3 600 000 |
|||||||||
Cash bonus1 |
1 472 000 |
2 208 000 |
3 680 000 |
|||||||||
Share-based bonus (FMV)3 |
1 146 235 |
1 719 435 |
2 865 670 |
|||||||||
Other benefits2 |
1 563 048 |
1 411 275 |
2 974 323 |
|||||||||
Total |
5 381 283 |
7 738 710 |
13 119 993 |
|||||||||
In both years there were no payments to leaving members of the Executive Committee nor were any loans or credits outstanding and or granted.
So the overall total compensation 2015 to the Executive Committee was below the approved budget of CHF 14.5 million (94%). This budget approval was made for the year 2015 at the Annual General Meeting in 2014.
Please find on the next page the information about the actual share and option ownership of the Members of the Executive Committee.
|
Hariolf Kottmann |
Patrick Jany |
Christian Kohlpaintner |
Mathias Lütgendorf |
Total |
|||||||
|
||||||||||||
Number of investment shares1 |
23 318 |
11 659 |
11 659 |
0 |
46 636 |
|||||||
Number of matching shares1 |
23 318 |
11 659 |
11 659 |
0 |
46 636 |
|||||||
Number of performance share units |
26 179 |
13 090 |
13 090 |
13 090 |
65 449 |
|||||||
Total number of shares |
72 815 |
36 408 |
36 408 |
13 090 |
158 721 |
|||||||
|
Number of shares granted for 20151 |
Number of shares granted for 20142 |
Number of shares within vesting |
Number of shares within vesting |
Number of |
Number of |
||||||||||
|
||||||||||||||||
Hariolf Kottmann |
72 815 |
66 161 (correction of 76 303) |
202 731 |
212 289 |
473 893 |
444 814 |
||||||||||
Patrick Jany |
36 408 |
33 082 (correction of 38 152) |
107 526 |
115 569 |
304 973 |
265 168 |
||||||||||
Christian Kohlpaintner |
36 408 |
33 082 (correction of 38 152) |
107 526 |
115 569 |
231 112 |
201 307 |
||||||||||
Mathias Lütgendorf |
13 090 |
33 082 (correction of 38 152) |
107 526 |
115 569 |
61 830 |
292 213 |
||||||||||
Total |
158 721 |
165 407 (correction of 190 759) |
525 309 |
558 996 |
1 071 808 |
1 203 502 |
||||||||||
|
Number of options granted for 2015 |
Number of options granted for 2014 |
Number of options within vesting period for 2015 |
Number of options within vesting period for 2014 |
Number of |
Number of |
||||||
Hariolf Kottmann |
0 |
0 |
0 |
0 |
0 |
383 682 |
||||||
Patrick Jany |
0 |
0 |
0 |
0 |
0 |
191 841 |
||||||
Christian Kohlpaintner |
0 |
0 |
0 |
0 |
0 |
120 000 |
||||||
Mathias Lütgendorf |
0 |
0 |
0 |
0 |
0 |
0 |
||||||
Total |
0 |
0 |
0 |
0 |
0 |
695 523 |
IFRS
The International Financial Reporting Standards (IFRS) are international accounting standards. VIEW ENTIRE GLOSSARY
Executive committee
Management body of joint stock companies; at Clariant the Executive Committee currently comprises four members. VIEW ENTIRE GLOSSARY