Global stock markets affected by growing economic uncertainties and historically low interest rates
The development of the stock exchanges worldwide was again driven by low interest rates and the growing economic uncertainties resulting in a continued high volatility during the year 2015. The central banks continued with their expanding monetary and low interest policies, which enhanced the demand for stocks. The European Central Bank (ECB) kept the prime rate at the all-time low introduced in the previous year close to zero percent, while the US Federal Reserve Bank did raise interest rates by 25 basis points in December 2015, signaling confidence in the strength of the US economy.
The solid economic growth in most industrialized countries helped major indices to post new all-time highs within the reporting year 2015. The worries concerning the future growth perspectives of the Chinese economy resulted in sharp corrections especially in the second half of the year. In a twelve-month retrospective, the Dow Jones Industrial Index lost 2.2% of its value. Japan’s stock exchange again benefited from massive cash injections by the Japanese central bank and showed a gain of +9.1%. Most of the major European stock exchanges were also able to post upward trends with high fluctuations especially during the third quarter. In a year-to-year comparison the Euro Stoxx 50 (+4.6%) and the German DAX (+9.6%) were up compared to the year-end 2014, whilst the leading Swiss index SMI lost 1.8%.
Clariant stock gains with a high share price volatility through the year
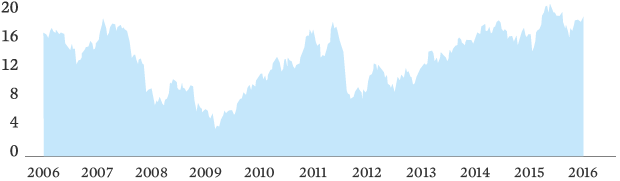
The general development on the stock markets also affected the performance of the Clariant shares. Starting the year at a price of CHF 16.72 the company benefited from the expectations for an improved profitability and the finalization of the successful portfolio repositioning. Therefore, the share price went up steeply – after a short drop in January after the appreciation of the Swiss franc – to its minimum price of CHF 13.50 on 22 January – to the peak price of CHF 21.70 on 22 April, reflecting a gain of roughly 25%. Following a period during which the price moved in a range between CHF 19 and CHF 21 the worries about a sharp weakening of the economy in China with unpredictable impacts on the global economy also affected the Clariant stock. From the beginning of August to the end of September the share price dropped almost 20% to CHF 16. Solid figures for the third quarter stimulated the demand for the stock again, allowing the Clariant share to finish the trading year with a market price of CHF 19.01 and a very positive share price performance of 13.7%. In view of this gain and the number of shares of approximately 322.2 million, the market capitalization of Clariant rose to CHF 6.3 billion, while the Enterprise Value (EV) amounted to roughly CHF 7.6 billion.
CLARIANT STOCK PRICE DEVELOPMENT 2006 – 2015
in CHF

In September 2015, the Clariant stock was announced to be a confirmed member of the Dow Jones Sustainability Index. According to the assessment of the analysts of RobecoSAM, when it comes to sustainability, Clariant now belongs to the top 4 of chemical companies worldwide.
WHY INVEST IN CLARIANT?
1. Clear strategy
Future valuation potential driven by transformation from a diversified chemicals company into a leading specialty chemicals company.
2. Strong market position
Clariant holds top three positions in most of its markets and has set strategies in place to gain and retain leadership positions through developments in all its markets.
3. Well-balanced Portfolio
The portfolio changes have turned Clariant into a specialty chemicals company with a broad geographical footprint with close to 50% of sales coming from emerging markets. The majority of the end-markets have inherent growth drivers.
4. Increasing returns for shareholders
Strong future cash flow generation and a sound balance sheet will allow Clariant to continuously distribute 25 to 35 % of recurring net income to its shareholders.
Maintained dividend
Clariant continues to strive to make stable or increasing dividend payments as a way of allowing shareholders to participate in the Group’s successes. In view of the solid operating performance in the business year 2015, allowing to compensate for the strength of the Swiss francs, the Board of Directors of Clariant Ltd decided to propose the distribution of an unchanged dividend of CHF 0.40 per share at the Annual General Meeting on 21 April 2016 for the 2015 financial year.
|
|
2015 |
2014 |
||||||
|
||||||||
|
Closing price on 31 December (CHF) |
19.01 |
16.72 |
||||||
|
Peak price (CHF) |
21.70 |
18.83 |
||||||
|
Lowest price (CHF) |
13.81 |
14.55 |
||||||
|
|
|
|
||||||
|
Number of shares on 31 December (m) |
331.94 |
331.94 |
||||||
|
In free float (%) |
87 |
87 |
||||||
|
Average daily trading volume (SIX) |
1 988 355 |
1 617 067 |
||||||
|
Market capitalization on 31 December (CHF m) |
6 310 |
5 550 |
||||||
|
|
|
|
||||||
|
Basic earnings per share (CHF)1 |
0.67 |
0.55 |
||||||
|
Adj. earnings per share (CHF)1 |
1.01 |
1.12 |
||||||
|
Distribution per share (CHF)2 |
0.40 |
0.40 |
||||||
More detailed information about Clariant can be found on the website: www.clariant.com
Contact Investor Relations:
Hardstrasse 61
CH-4133 Pratteln, Switzerland
Telephone: + 41 61 469 63 73
Fax: + 41 61 469 67 67
Clariant outlook 2016: EBITDA margin and operating cash flow to progress
Despite the difficult environment in 2015, Clariant could demonstrate its ability to sustainably improve its business performance by continuously launching new innovative products and solutions particularly in its higher margin Business Areas Care Chemicals, Catalysis and Natural Resources.
Clariant expects the uncertain environment, characterized by a high volatility in commodity prices and currencies, to further deteriorate. In emerging markets, we anticipate the economic environment to become more challenging and with increased volatility; we expect moderate growth in the United States, while growth in Europe is expected to remain stable but weak.
For 2016, in spite of the increasingly challenging economic environment, Clariant is confident to achieve growth in local currencies, as well as progression in operating cash flow and EBITDA margin before exceptional items.
Clariant confirms its mid-term target of reaching a position in the top tier of the specialty chemicals industry. This corresponds to an EBITDA margin before exceptional items in the range of 16% to 19% and a return on invested capital (ROIC) above the peer group average.
TARGETS FOR 2016
- Further sales growth in local currencies
- Progress in EBITDA1 margin
- Progress in operating cash flow generation
1 before exceptional items
MID-TERM TARGETS
Organic sales1 >
EBITDA2 margin
ROIC3
> global GDP growth 16 – 19 % > peer group average1 in local currencies
2 before exceptional items
3 Return on Invested Capital