|
2015 |
2014 |
Change in % |
|||
Sales |
5 807 |
6 116 |
–5 |
|||
Gross profit on sales |
1 787 |
1 772 |
1 |
|||
EBITDA before exceptional items |
853 |
867 |
–2 |
|||
Margin (%) |
14.7 |
14.2 |
|
|||
EBIT before exceptional items |
596 |
585 |
2 |
|||
Margin (%) |
10.3 |
9.6 |
|
|||
EBIT |
496 |
525 |
–6 |
|||
Income before taxes |
300 |
379 |
–21 |
|||
Net income |
227 |
235 |
–3 |
|||
Basic earnings per share |
0.67 |
0.55 |
22 |
|||
Adjusted earnings per share |
1.01 |
1.12 |
–10 |
Solid sales growth in local currencies driven by improved volumes
Driven by a solid volume growth, Group sales in local currencies improved by 3% compared to the preceding year. As a result of the negative exchange rate effect of –8%, Clariant reported a decrease of 5% to CHF 5 807 million in the 2015 reporting year (2014: CHF 6 116 million). Sequentially an improving sales progression was observed during the year. The fourth quarter was the strongest in terms of sales, driven by volume increase.
Solid growth in Latin America
Despite the economic uncertainties, Clariant was able to report good sales growth of 19% in Latin America in local currencies. After conversion into Swiss francs, sales only grew by 4%, given the substantial devaluation of the region’s currencies. A solid sales growth of 4% in local currencies was generated in North America, which corresponded to growth of 7% in CHF. Europe showed a slight decline in sales of 1% in local currencies impacted by Germany. Due to the fact that many important countries in the Middle East and Africa were severely affected by the drop in the oil price, sales in this region decreased by 6% in local currencies compared to 2014 (–12% in CHF). Asia-Pacific posted a decline of 1% in local currencies (–4% in CHF), mainly negatively impacted by China, which dropped 14% in local currency (–13% in CHF).
|
2015 |
2014 |
Change |
Change in |
||||||||
|
||||||||||||
Europe |
1 931 |
2 232 |
–13 |
–1 |
||||||||
MEA1 |
405 |
461 |
–12 |
–6 |
||||||||
North America |
1 077 |
1 006 |
7 |
4 |
||||||||
Latin America |
1 021 |
984 |
4 |
19 |
||||||||
Asia-Pacific |
1 373 |
1 433 |
–4 |
–1 |
||||||||
Total |
5 807 |
6 116 |
–5 |
3 |
||||||||
Sales Structure by Currencies 2015
in %
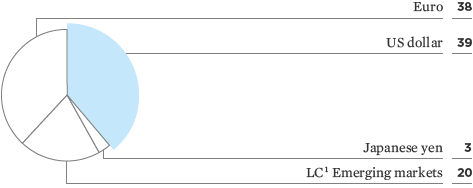

1 LC = Local currency
Cost Structure by Currencies 2015
in %
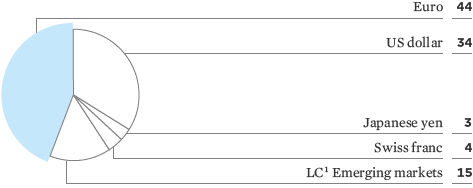

1 LC = Local currency
|
2015 |
2014 |
Change |
Change in |
||||||||
|
||||||||||||
Care Chemicals |
1 445 |
1 511 |
–4 |
4 |
||||||||
Catalysis2 |
704 |
729 |
–3 |
4 |
||||||||
Natural Resources |
1 217 |
1 297 |
–6 |
4 |
||||||||
Plastics & Coatings |
2 441 |
2 579 |
–5 |
1 |
||||||||
Total |
5 807 |
6 116 |
–5 |
3 |
||||||||
The sales developments of all four underlying business operations were positive in local currencies in 2015, but dropped in Swiss francs. Sales of Care Chemicals increased by 4% in local currencies (–4% in CHF) due to a strong growth in Consumer Care products. Sales in Catalysis increased by 4% in local currencies (–3% in CHF) driven by a strong demand in North America. Natural Resources posted solid gains in local currencies of +4% (–6% in CHF). Plastics & Coatings was up 1% in local currencies (–5% in CHF), mainly driven by Masterbatches.
Gross and EBITDA margins further improved In view of a better product mix, lower raw material prices and reclassification of costs to Selling, General and Administrative Expenses (SG&A), Clariant was able to improve the gross margin from 29.0% in 2014 to 30.8% in 2015.
The Group’s EBITDA before exceptional items improved by 8% in local currencies (–2% in CHF) to CHF 853 million (2014: CHF 867 million). The EBITDA margin improved from 14.2% to 14.7%.
|
2015 |
2014 |
Change |
Change in |
||||||||||||
|
||||||||||||||||
Care Chemicals |
272 |
259 |
5 |
14 |
||||||||||||
Catalysis3 |
177 |
171 |
3 |
12 |
||||||||||||
Natural Resources |
206 |
191 |
8 |
18 |
||||||||||||
Plastics & Coatings |
313 |
360 |
–13 |
–8 |
||||||||||||
Total4 |
853 |
867 |
–2 |
8 |
||||||||||||
The improvements were driven by the Business Areas Care Chemicals (+14% in local currencies; +5% in CHF), Catalysis (+12% in local currencies; +3% in CHF) and Natural Resources (+18% in local currencies; +8% in CHF; ). Plastics & Coatings was below the previous year’s level (–8 % in local currencies; –13% in CHF).
|
2015 |
2014 |
||||||||
|
||||||||||
Care Chemicals |
18.8 |
17.1 |
||||||||
Catalysis2 |
25.1 |
23.5 |
||||||||
Natural Resources |
16.9 |
14.7 |
||||||||
Plastics & Coatings |
12.8 |
14.0 |
||||||||
Total3 |
14.7 |
14.2 |
||||||||
The progression in EBITDA margin before exceptional items came primarily from the Business Areas Care Chemicals, Catalysis, and Natural Resources. They significantly increased their EBITDA margins throughout 2015 compared to the previous year, while in Plastics & Coatings the margin declined versus the previous year due to the increasingly challenging markets.
In order to increase profitability and cash flow over a sustained period, Clariant implements measures designed to improve the Group’s performance. The aim of these efforts is to increase the Group’s operating result.
The changes made to the processes and structures generated restructuring expenses that amounted to CHF 51 million in 2015 (2014: CHF 96 million). The impairment loss recognized in 2015 (CHF 14 million) relates to disposal projects. The amount decreased significantly compared to 2014 (CHF 116 million). The negative impact of loss on impairment was offset by gain from disposal of activities not qualifying as discontinued operations amounted to CHF 15 million in 2015 (2014: CHF 168 million). Notwithstanding, the operating income (EBIT) decreased in 2015 to CHF 496 million (2014: CHF 525 million).
The negative financial result increased from CHF 146 million to CHF 196 million in 2015 mainly due to the negative currency result. Income before taxes decreased accordingly to CHF 300 million (2014: CHF 379 million). After the impact of taxes, the net result from continuing operations amounted to CHF 227 million compared to CHF 235 million in 2014.
Considering the solid business development which almost fully compensated for the appreciation of the Swiss franc, Clariant’s Board of Directors have decided to propose to the general assembly an unchanged distribution of CHF 0.40 per share for 2015. The corresponding proposal will be presented to the 21st Annual General Meeting on 21 April 2016.
Masterbatches
These are plastic additives in the form of granules with dyestuffs or other additives used to dye or alter the properties of natural plastic. VIEW ENTIRE GLOSSARY
EBITDA margin
The EBITDA margin is calculated based on the ratio of EBITDA to sales and shows the return generated through operations from sales before depreciation and amortization. VIEW ENTIRE GLOSSARY
Cash flow
Economic indicator representing the operational net inflow of cash and cash equivalents during a given period. VIEW ENTIRE GLOSSARY